Last year, we celebrated 50 years since the first papers on fluorescence correlation spectroscopy (FCS) were published. It wasn't a wild celebration with masses on the streets, nor was it widely celebrated in universities, but rather a quiet admiration by people in the field for one of the cornerstone methods that has advanced our understanding of many processes at the molecular scale.
FCS began to shine with the availability of confocal microscopes in the 1990s and has since been actively used to study chemical reactions, formation of aggregates, molecular movements in cells, and attachment of molecules to membranes, to name a few applications. By examining all these processes at the molecular scale, it becomes possible to study many aspects of physiology and material science at the single-molecule level. Through deep understanding of these processes, researchers can design drugs, discover new intracellular interactions, and advance materials in ways that would otherwise be impossible or very difficult.
New breakthrough from Estonian scientists
Recently, a team of Estonian scientists from the Laboratory of Systems Biology (Department of Cybernetics, TalTech) published a study that may revolutionize how we analyze FCS measurements and address one of the major weaknesses in this approach. They used powerful computational tools originally built for artificial intelligence, but instead of relying on AI's "black box" methods, they applied these tools to optimize transparent, physics-based models.
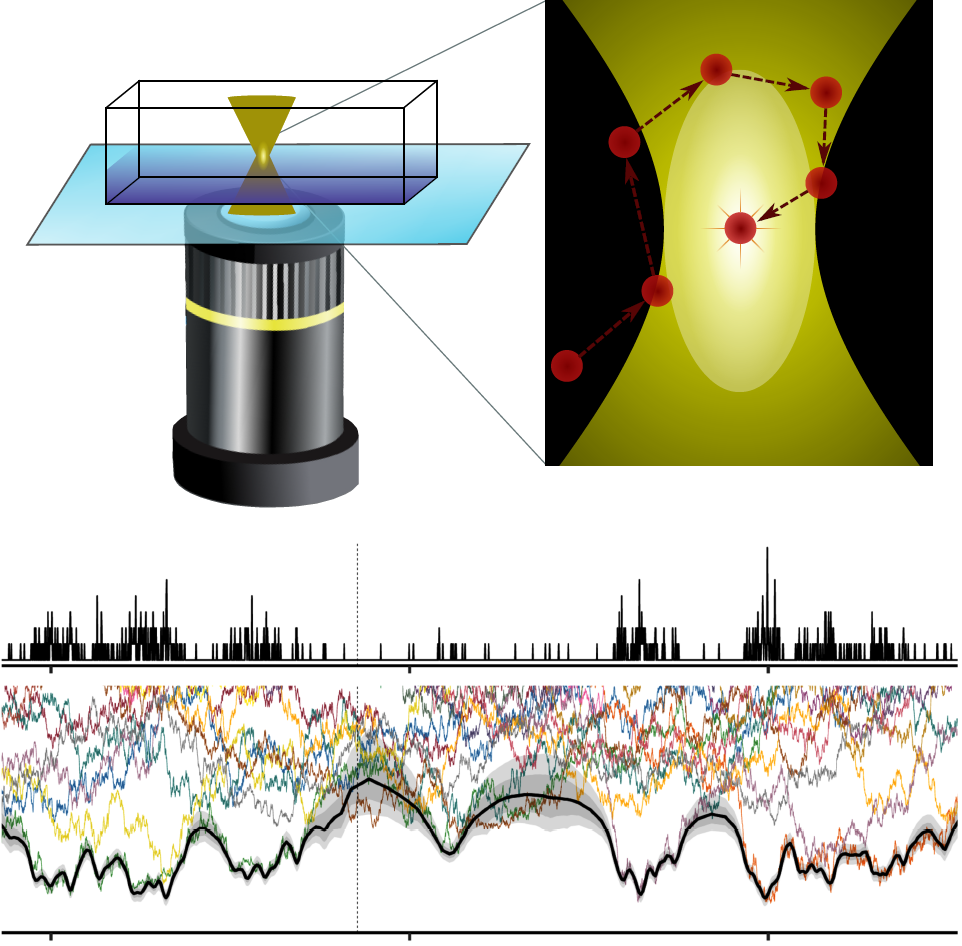
To explain what has been accomplished and why it matters, we first need to cover the basics of FCS. At its core, FCS works by recording data from a very small volume — around a femtoliter (one quadrillionth of a liter, a smallest grain of sand in an Olympic swimming pool). In its classical form, FCS uses a confocal microscope to make such a small measurement volume possible. In a confocal microscope, a laser is focused on the sample, whether it's a cell or other object, and the signal is collected only from the very small volume at the laser's focus. FCS is applied when we have very few molecules in this volume that can fluoresce – a property that allows certain molecules to emit light when excited by photons. With so few molecules, the signal becomes very noisy. However, it's possible to associate increases in the signal with either molecules arriving in the volume, changing through chemical reactions, or sticking to surfaces. In principle, anything that changes the fluorescence in that volume can be associated with some physical process, like movement or reaction, can be studied.
How does FCS work?
To build intuition about FCS signal processing, imagine you want to learn whether one cashier in a shop works faster than another. One option is to let only one of them work and see how quickly they can process a long queue of customers. Unfortunately, while simple, this experiment would result in a rather large group of unhappy customers. The alternative is to have both cashiers work during quiet periods when there are few customers, and record when each customer arrives at the checkout point and leaves it. By focusing on just the small space around each cashier, you can determine the average time for processing a customer and whether these cashiers work at different speeds. This is essentially what FCS does with molecules: by tracking when fluorescence signals increase (molecules entering the observation volume) and decrease (molecules leaving), FCS can derive the corresponding molecular properties, such as how fast they move.
Autocorrelation and its statistical problem
While we can track customers fairly easily, working at the molecular level creates immediate problems due to poor signal quality. Molecules don't always emit photons, many photons get missed, and unwanted signals can interfere — making the data very noisy. To work around this, FCS measures rapidly (every microsecond) and repeatedly, collecting lots of data to analyze. It turns out that one very useful way to extract something analyzable from such a noisy signal is to calculate the signal's autocorrelation. Essentially, autocorrelation tells you the chances of seeing an elevated signal after some time when you observed a spike in fluorescence. Indeed, if a large, slow-moving molecule enters the observation volume, the signal stays elevated until that molecule wanders away. By analyzing these autocorrelations, we can determine how fast molecules move.
Over the years, FCS development has taught us how to read autocorrelations like a fingerprint — they reveal whether we're seeing simple molecular movement, chemical reactions, particles of different sizes, or particles that interact with each other. However, there's a major problem with how we analyze these autocorrelations. The issue is statistical: since all the autocorrelation values come from the same single experiment, they're not truly independent measurements. To understand this, imagine taking one day's temperature measurements every minute and asking: "How similar is the temperature now to what it was 1 hour ago? 2 hours ago? 4 hours ago?" Each comparison tells you something real about temperature patterns — the pattern would even reveal whether it was a sunny day or a cloudy. But because all these similarity measurements come from the same temperature dataset, they're not statistically independent. As a result, you can't properly assess the reliability of your conclusions — you might think you have strong evidence for a weather pattern, but you really just have one day's data analyzed in multiple ways. Similarly, in FCS, while each autocorrelation value at different time delays reveals genuine information about molecular behavior, they're all calculated from overlapping portions of the same fluorescence data.
Uncomfortable choices
To analyze these autocorrelations correctly, as demonstrated by several research groups, experiments would have to be much longer than is practical or even possible. Experimental time is ultimately limited by the amount of laser exposure your cell or other object can handle, and for living cells, this time is quite limited. This creates an uncomfortable choice: use FCS incorrectly or don't study the system at all.
About six years ago, a research group in the USA proposed an alternative approach: dropping autocorrelation from the analysis and using mathematical models that work directly with the noisy experimental data to extract the same information as from FCS. Their goal was to shorten experimental time by requiring less data. Like many others, the Estonian team was very interested in this approach and wanted to apply it to study molecular movement in heart muscle cells. However, it turned out that the original implementation was very slow and, unexpectedly, was quite sensitive to initial guesses about key properties, such as a researcher's estimate of how bright the molecule is. This sensitivity could result in arriving at incorrect answers or failing to find any answer at all. So while the idea of directly analyzing noisy FCS data was very attractive – particularly since it would also avoid the statistical data handling issues that plague traditional FCS – there were many practical issues with applying it.
FITSA required several times less data than FCS
In their recent study, the Estonian group published a new method based on the same idea as proposed earlier — directly analyzing the fluorescence signal — but overcoming many issues encountered in the earlier implementation. They demonstrated that the new method — fluorescence intensity trace statistical analysis (FITSA) — is very robust and doesn't require precise knowledge of molecular properties before the experiment.
Particularly interesting is the quantitative analysis of how much less data is needed to estimate molecular properties using FITSA versus classical FCS. Even when using FCS in its incorrect mode, FITSA required several times less data than FCS. When comparing with FCS as it should be properly applied, the differences become staggering: FITSA requires 300 to 21,000 times less data than FCS. Due to such huge differences, FITSA opens new opportunities to study these processes with scientific rigor not possible before.
Revolutionary discovery
The researchers envision that FITSA and methods based on similar approaches will replace classical FCS analysis pipelines in all their applications in life and materials science. Currently, there are still many practical problems to solve, but what FITSA has demonstrated is that there's a major advantage in direct analysis of experimental data. With further advances, it will allow us to study molecular environments and molecular interactions in a much more precise manner.
The implications could be transformative: imagine being able to follow how drugs interact with diseased cells with unprecedented precision, or rapidly screening thousands of potential new medicines by observing their molecular behavior in living cells. FITSA could enable researchers to study cellular processes that required prohibitively long experiments, potentially revolutionizing our understanding of everything from heart diseases to the development of advanced materials.
This research was supported by the Estonian Research Council (PRG1127), with results published in Science Advances.